Question: Can you recommend a tool that turns complex data into interactive and easy-to-understand dashboards?

Tableau
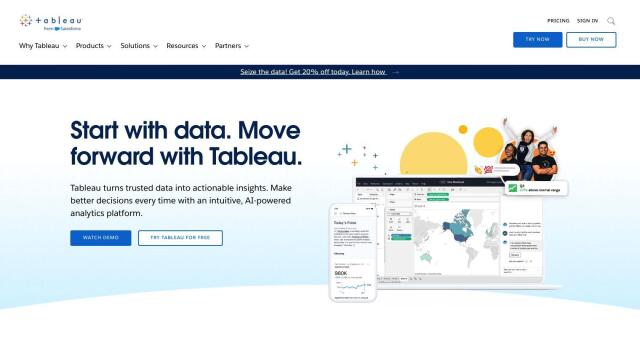
If you want a tool to transform raw data into interactive, easily understood dashboards, Tableau is a top contender. This business intelligence and analytics tool lets you create visualizations with a drag-and-drop interface and share results with others. It's got features like AI/ML, governance and data management to make it easy to use and collaborate. Tableau customers include Whole Foods Market and Keybank, and the company says its technology helps with data democratization and turning data into business insights.

Polymer
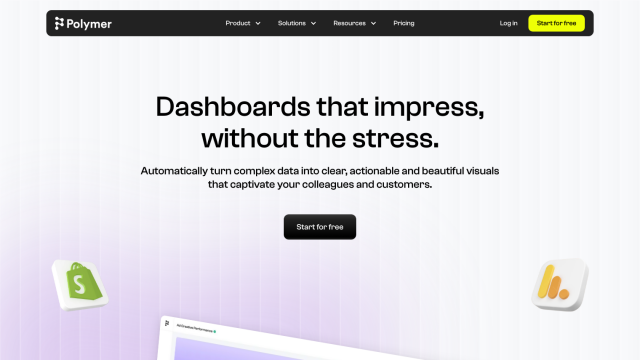
Another strong contender is Polymer. This AI-powered dashboard creation tool transforms raw data into insights fast, without requiring data science or engineering skills. Polymer has more than 20 data connectors, real-time insights through automated updates, and a range of pre-built templates. Its AI-driven insights and personalized visualization tools let users dig into data and present it in a format that's easy to understand.

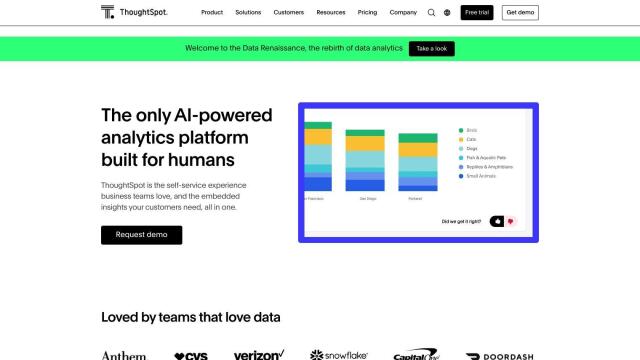
ThoughtSpot
ThoughtSpot is another powerful tool that lets you ask complex data questions in plain-English language and get AI-powered answers. This self-service analytics tool is geared for business teams and product builders, with search, visualization and drill-down abilities. With natural language queries and built-in analytics, ThoughtSpot makes it easy to explore and share data so you can make business decisions.

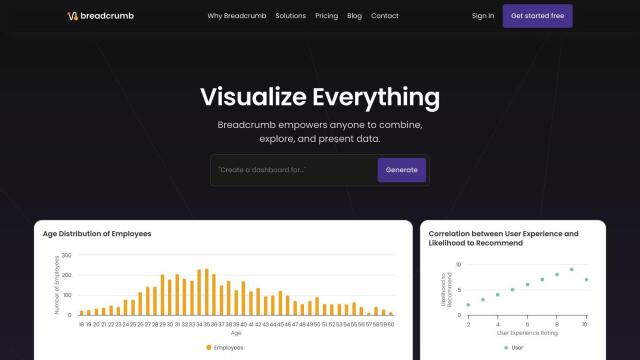
Breadcrumb
If you prefer a more direct approach, Breadcrumb transforms data and spreadsheets into interactive AI-powered dashboards. It can connect to a range of data sources, including Excel and Google Sheets, and offers features like AI-generated dashboards, real-time operational optimization and plain language querying. It's good for people who want to get insights without having to hire a data scientist, with several pricing tiers to match your needs.

