Question: I'm looking for a solution that allows me to create custom dashboards for financial reporting and analysis, can you suggest one?

Tableau screenshot thumbnail

Tableau

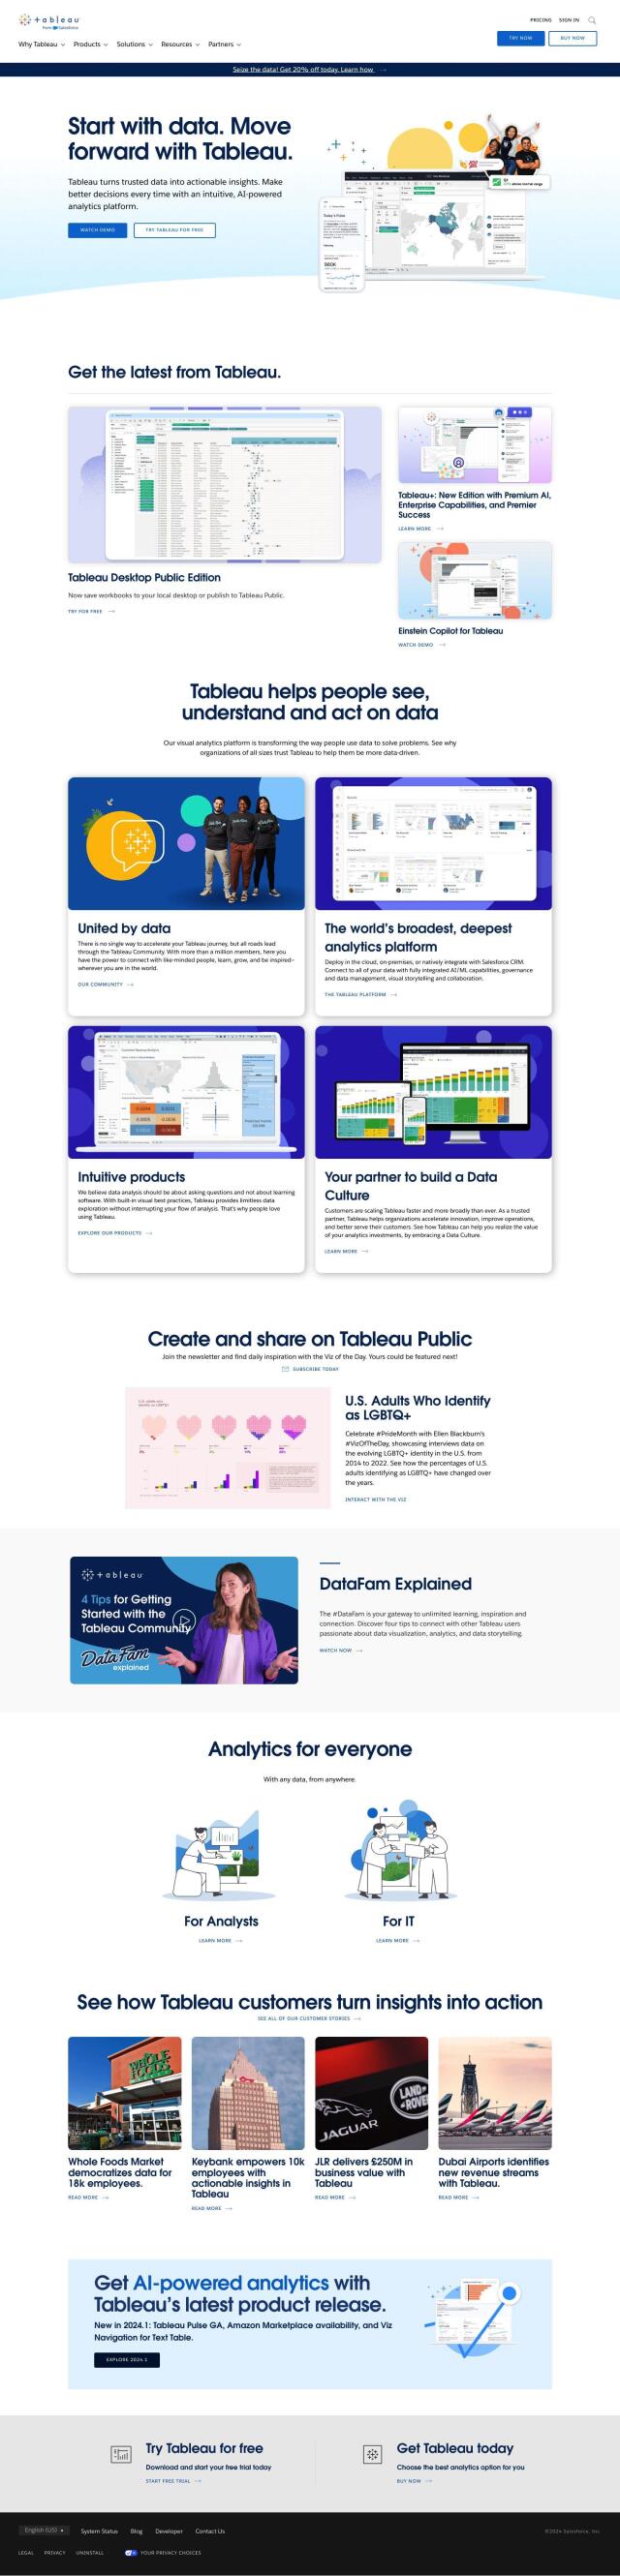
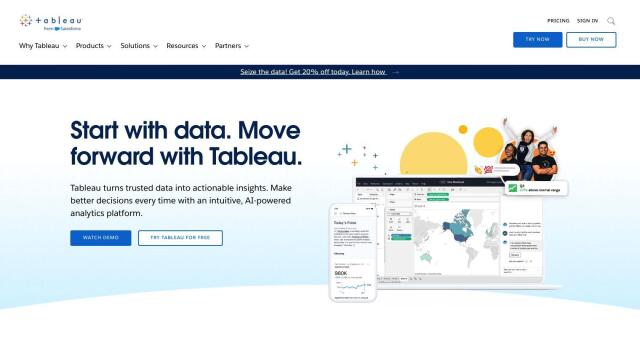
If you need a tool to build your own custom dashboards for financial reporting and analysis, Tableau is a popular option. Tableau lets you connect to a variety of databases, create visualizations with a drag-and-drop interface, and share results with others. It has a lot of features, including cloud, on-premises and Salesforce CRM deployment options, AI/ML integration and collaboration tools. Tableau is used by companies like Whole Foods Market and Keybank to help democratize data and get more actionable insights.

Syft screenshot thumbnail

Syft

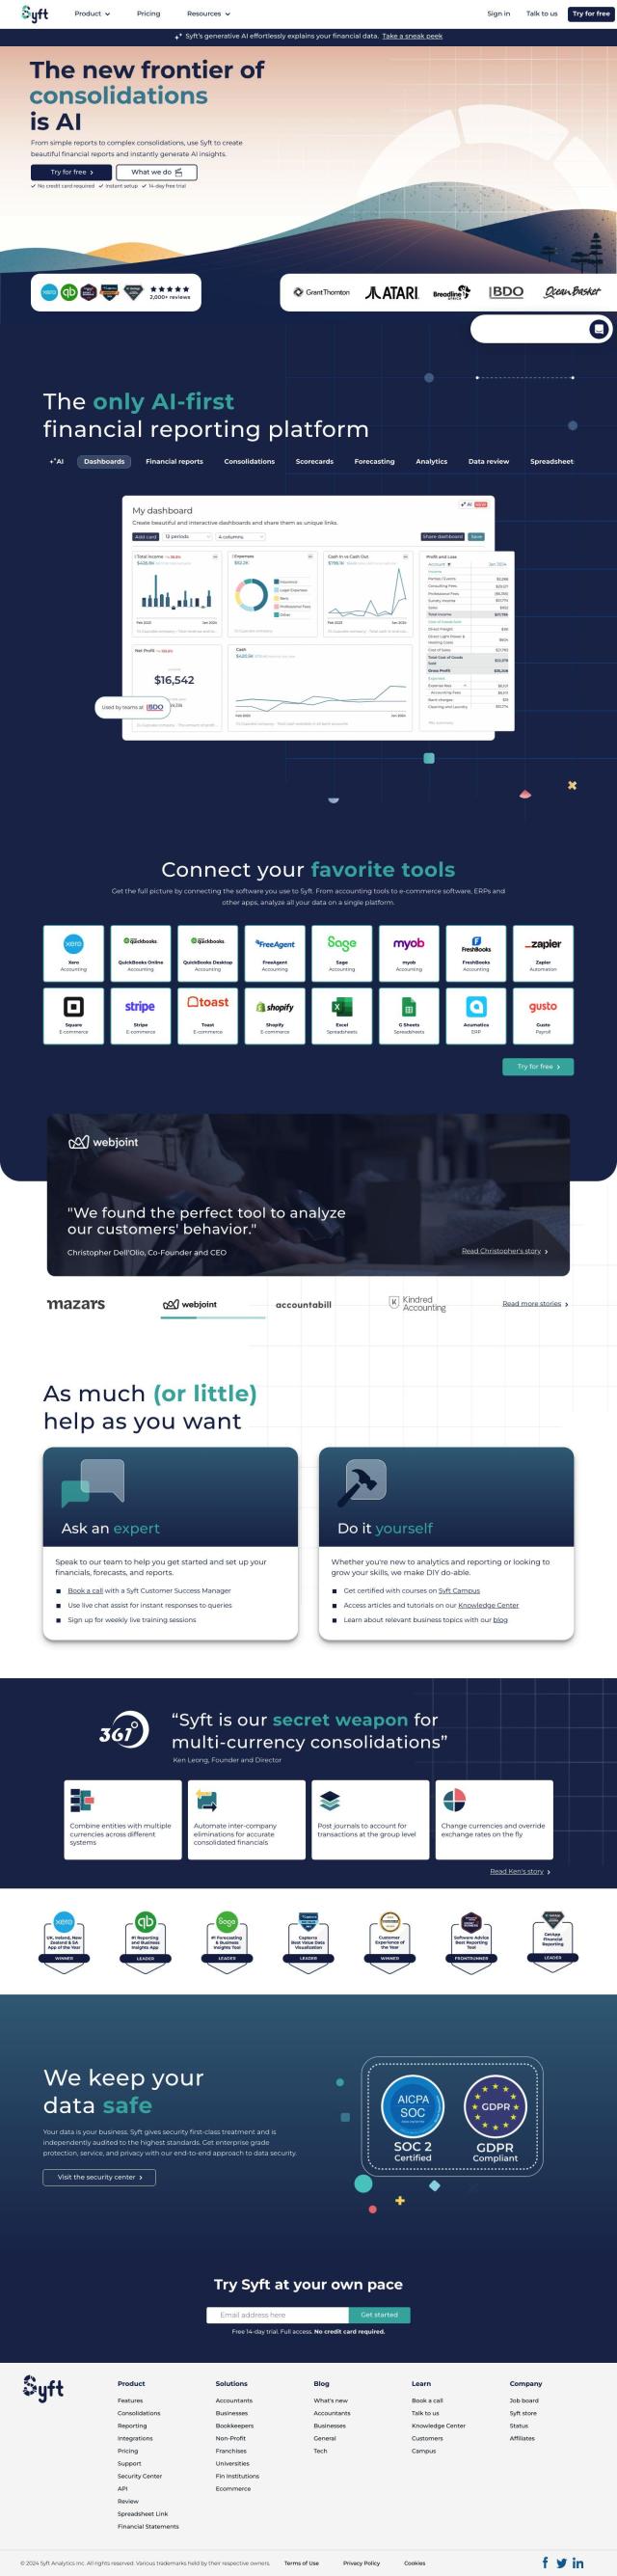
Another all-purpose option is Syft, which connects to a variety of accounting software, e-commerce platforms and ERPs to analyze data across multiple sources. It also offers customizable dashboards for fast financial performance analysis, consolidations with multi-currency support and automated inter-company eliminations. Syft is geared for accountants, businesses and nonprofits, so you can be sure your financial reports and forecasts are accurate and look good.
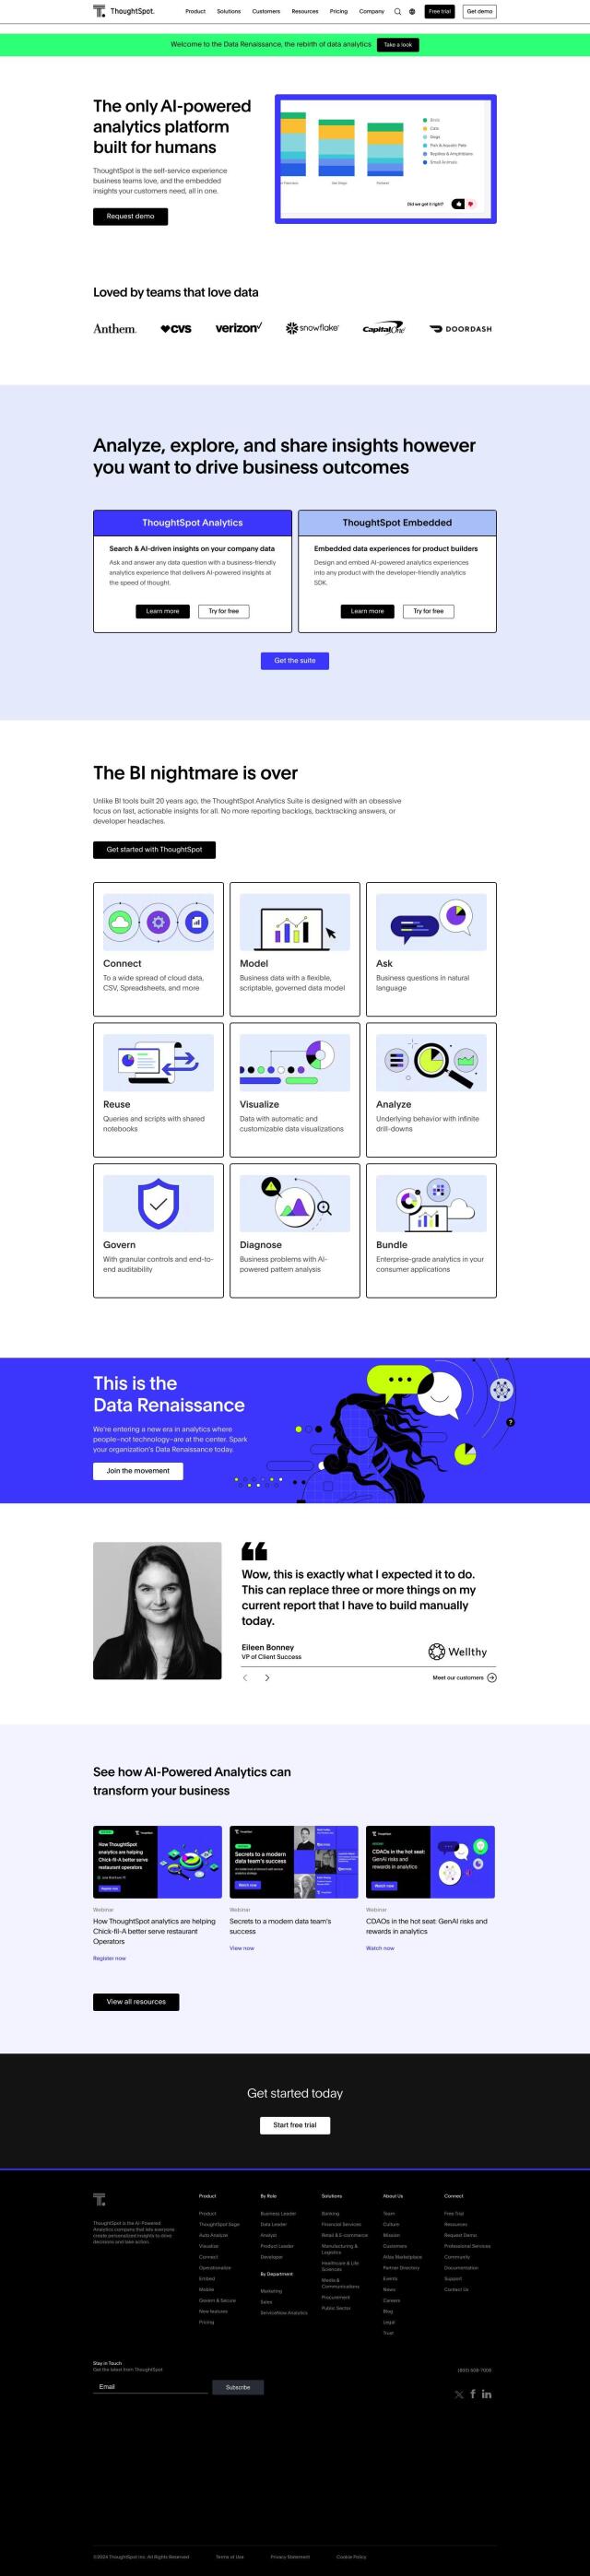
ThoughtSpot screenshot thumbnail

ThoughtSpot

If you want something more AI-powered, ThoughtSpot lets you ask complex data questions in plain English and get answers and insights. It has search, AI-driven insights, flexible data modeling and visualization tools. ThoughtSpot is good for data-driven decision making and analytics modernization, so it's good for finance and other industries.
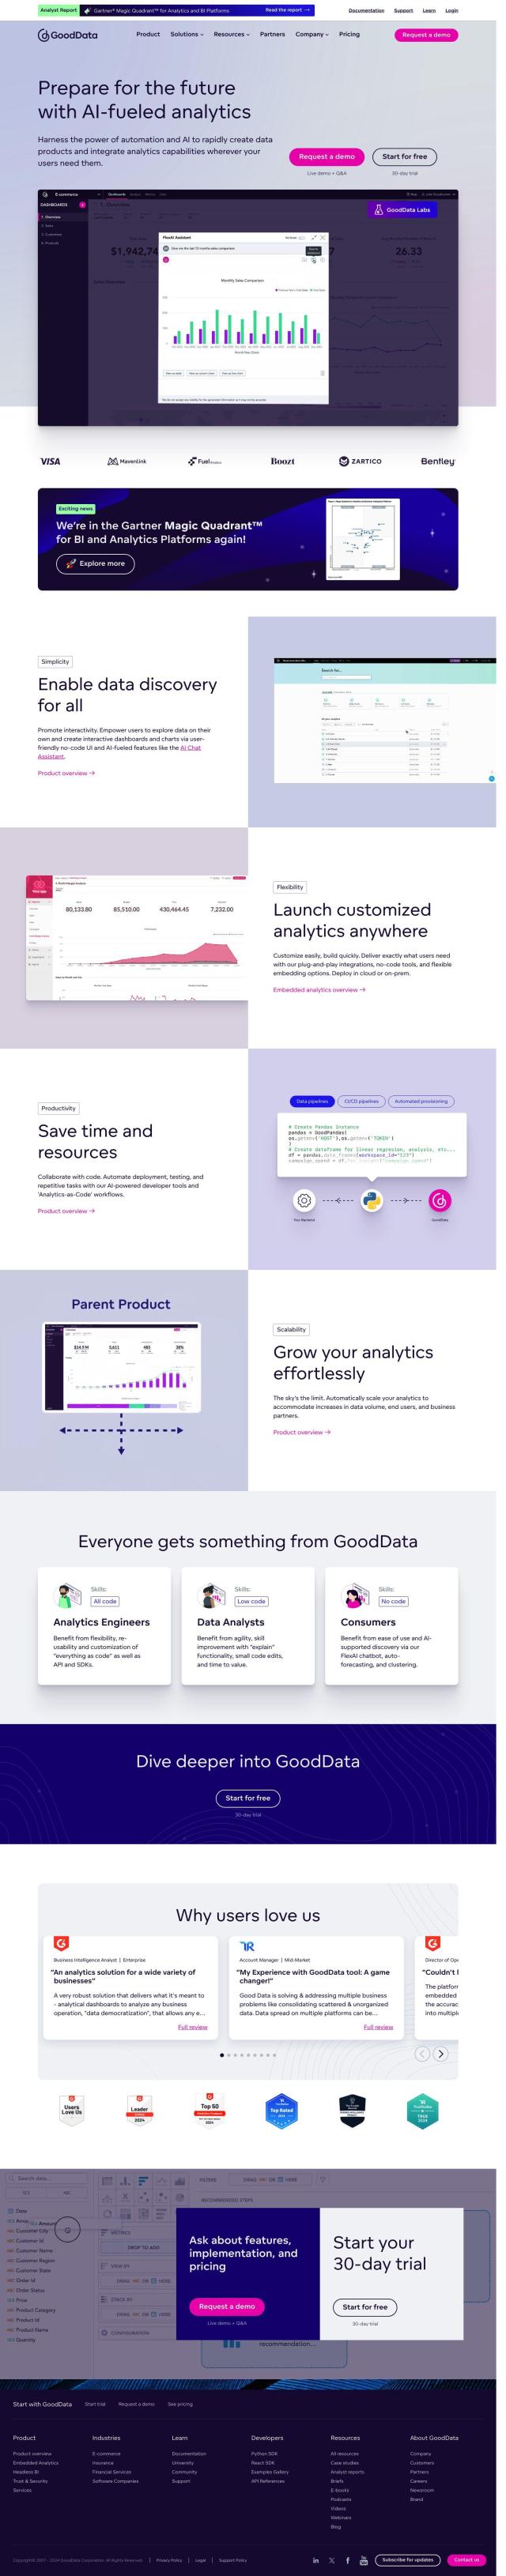
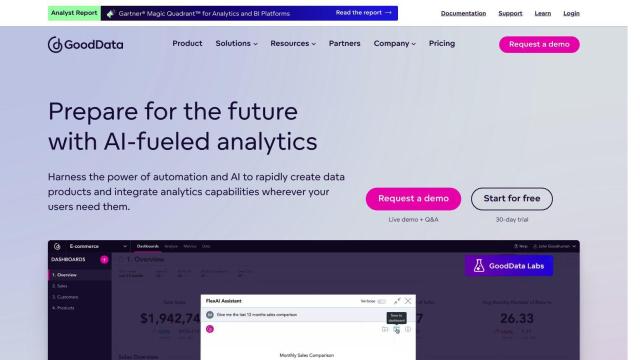
GoodData screenshot thumbnail

GoodData

Last, GoodData has a no-code interface and AI Chat Assistant for building custom data products with interactive analytics. It offers customizable dashboards, embeds analytics into workflows and automates data analysts' and engineers' work. GoodData is good for anyone who needs a flexible, scalable foundation for building data products as quickly and easily as possible.

Additional AI Projects

Spotfire screenshot thumbnail

Spotfire

Combines self-service data visualization and advanced data science in a single workflow, empowering users to connect, analyze, and act on data for better business outcomes.

Sigma screenshot thumbnail

Sigma

Combines spreadsheet-like data analysis with large-scale data handling, integrating trusted AI models for secure, auditable, and collaborative decision-making workflows.

Polymer screenshot thumbnail

Polymer

Converts complex data into intuitive, actionable visualizations, linking multiple sources and generating real-time insights with AI-driven analytics and suggested trends.

Causal screenshot thumbnail

Causal

Build financial models by connecting to multiple data sources, and analyze your business with human-readable formulas and granular permissions.

Onvo screenshot thumbnail

Onvo

Create interactive charts and insights with simple AI prompts, eliminating the need for complex queries and customizations.

Jedox screenshot thumbnail

Jedox

Jedox offers flexible financial planning and analysis tools for data-driven decision making.

Board screenshot thumbnail

Board

Transform complex data into better decisions with real-time insights, faster planning cycles, and flexible collaboration across finance, supply chain, sales, and more.

Tabula screenshot thumbnail

Tabula

Automate data workflows, standardize disparate sources, and gain real-time insights without coding, empowering data-driven decision-making across departments.

Facta screenshot thumbnail

Facta

Centralize and automate financial data from multiple sources into one unified set, enabling customized business intelligence and real-time analysis.

Explo screenshot thumbnail

Explo

Embed interactive dashboards and self-serve reporting directly into products, enabling end-users to customize analytics experiences and make better decisions.

Vizzly screenshot thumbnail

Vizzly

Build and share interactive, customizable analytics experiences with a no-code dashboard builder, empowering users to explore data without technical hassle.

Canvas screenshot thumbnail

Canvas

Link, query, and visualize data from 150+ SaaS tools without coding, empowering non-technical teams to make data-informed decisions.

Airbook screenshot thumbnail

Airbook

Accelerate data analysis and insights generation across teams with native connectors to 150+ data sources, collaborative querying, and visualization tools.

Butter screenshot thumbnail

Butter

Unifies financial data from various sources, providing real-time insights and customizable reporting to inform business decisions.

Breadcrumb screenshot thumbnail

Breadcrumb

Transform data into interactive AI dashboards, connecting multiple sources, and track trends in real-time with 100% accurate visualizations and natural language queries.

Embeddable screenshot thumbnail

Embeddable

Craft compelling customer-facing analytics experiences and embed them directly into your application, with full control and flexibility, in a fraction of the time.

Datarails screenshot thumbnail

Datarails

Automates financial data consolidation, reporting, and budgeting, freeing finance teams to focus on strategy and business development.

Hex screenshot thumbnail

Hex

Unify data teams with AI-assisted exploration, collaboration, and interactive reporting, accelerating data work and improving accuracy in a single, modular workspace.

Planful screenshot thumbnail

Planful

Connects data, provides AI-powered insights, and simplifies financial planning, budgeting, and forecasting to drive informed business decisions.

Alteryx screenshot thumbnail

Alteryx

Automates workflows, delivers self-service insights, and aligns data analysis with strategic business outcomes, empowering enterprise analytics for all users and roles.