Question: Can you recommend a business intelligence tool that offers a simple interface for creating interactive dashboards and setting up data alerts?

Canvas
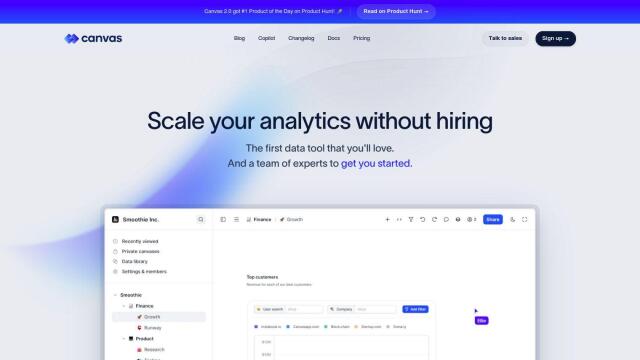
For a business intelligence tool with a relatively simple interface for building interactive dashboards and setting up data alerts, Canvas is a great choice. The tool lets non-technical teams explore and visualize data from more than 150 SaaS tools without having to write code. Canvas has real-time alerts, prebuilt templates for startup key metrics, and an interface that's easy to use. It also supports multiple users and integrates with tools like Salesforce and HubSpot.

Onvo
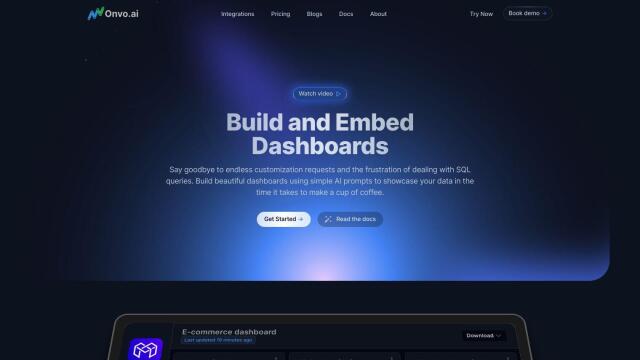
Another option is Onvo, an AI-powered data visualization tool that uses AI prompts to make dashboard creation easier. It connects to many data sources, including MongoDB and Google Sheets, and offers styling controls and sharing abilities. Onvo's AI technology can help automate workflows and data visualization, making it a good choice for startups and enterprises.

Trevor
Trevor is another good choice, especially for non-technical teams. It's easy to set up and supports a wide range of databases. Trevor has a query builder, good visualizations, alerts and workflows, so it's fast and easy to use for analytics. It has a free tier and a pricing model based on the number of credits used.


DataChat
If you want a no-code option, DataChat is a generative AI platform that converts complex data into actionable information through chat boxes and spreadsheets. It automates data preparation and modeling and includes built-in machine learning and predictive analytics. DataChat is good for data scientists, analysts and business users who need to make quick decisions with confidence.

