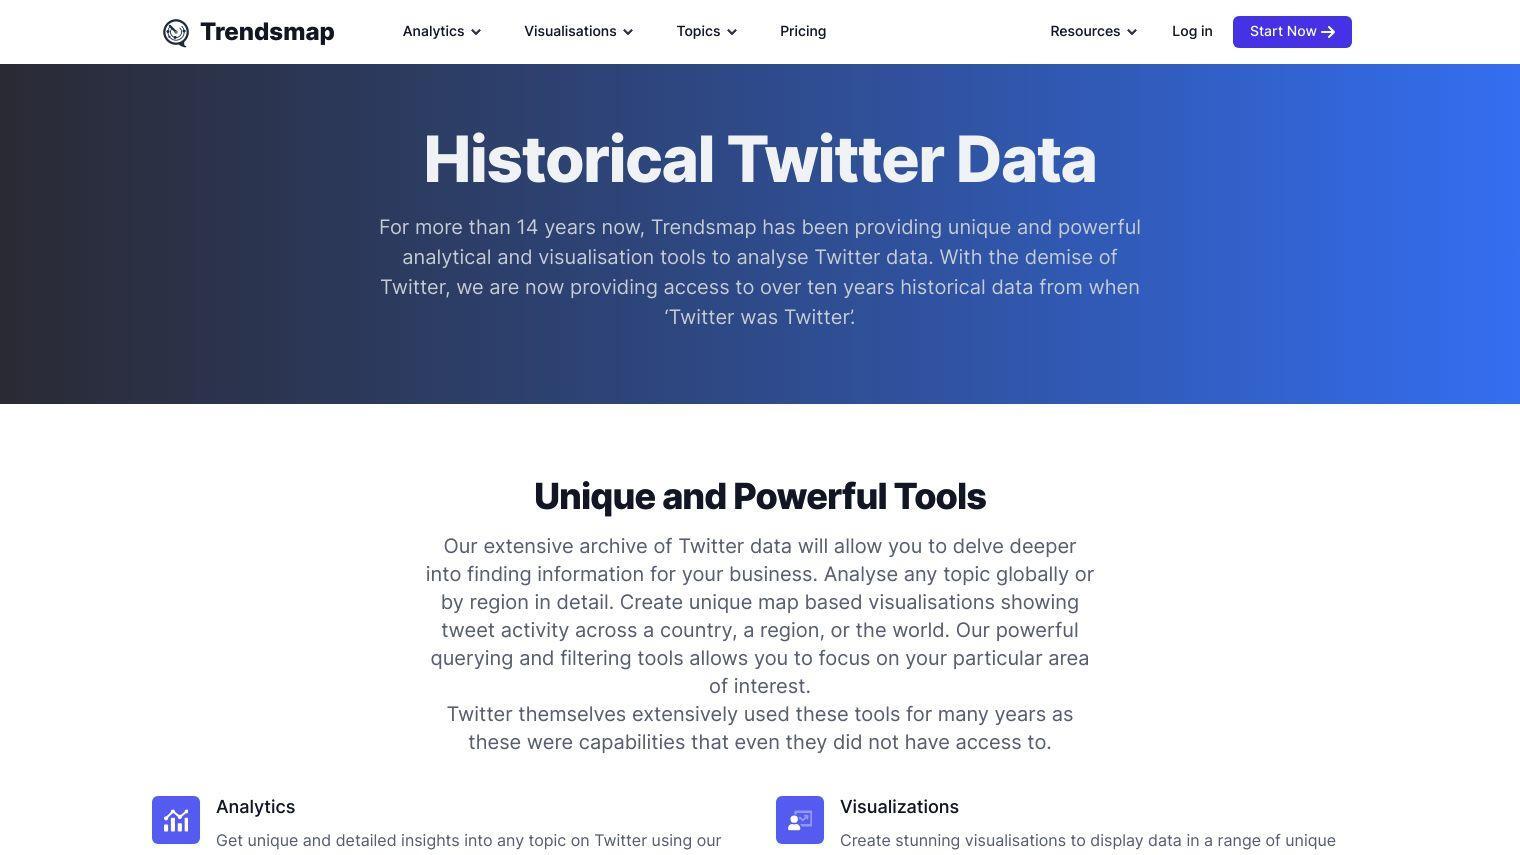
Trendsmap also offers more-advanced analysis and visualization tools for Twitter data, letting you see what's happened in the past and what's trending now. With more than a decade of Twitter data, Trendsmap can help you analyze and visualize information for a global audience or for a specific region.
Trendsmap's tools let you dig deeply into tweet data with filtering and querying. Among the tools it offers:
- Analytics: Get new insights into any topic using advanced query abilities. You can filter data by country, language and time to narrow your search.
- Visualizations: Create your own map-based visualizations to see tweet activity in a particular country or region or worldwide.
- Topic Search: Search for words, people and hashtags that contain specific words.
- Topic Trends: See how words, hashtags or people have been used over the last decade to see how often they've been used and how they've changed over time.
Subscriptions let you pay for different levels of historical data and analytics abilities. The Historical plan costs $100 per month, letting you explore up to 2 years' worth of data and create 20 analytics reports per month. Historical Plus, at $200 per month, lets you explore 5 years' worth of data and create 50 reports. Historical Pro, at $500 per month, lets you explore more than 10 years of data, create unlimited analytics, and download data.
Trendsmap can be useful for journalists, researchers, investigators and marketers who want to understand historical Twitter trends and data. You can better engage with your community, track the success of a campaign and understand what people are up to.
The service can be useful for anyone trying to gauge audience sentiment, track the spread of ideas and find connections that aren't immediately apparent. Trendsmap's historical perspective can help you find the data to support your research and storytelling.
Take a look at Trendsmap to see what's happened in the past on Twitter and to try its tools for your business or research.
Published on June 25, 2024
Related Questions
Tool Suggestions
Analyzing Trendsmap...

