MyUptimeKuma also lets you run your own UptimeKuma instance with minimal installation hassle. That's handy for Tesla owners who want to monitor and graph all sorts of car data, like charging, trips taken, sleep and updates, and who want to see that data in statistics and graphs.
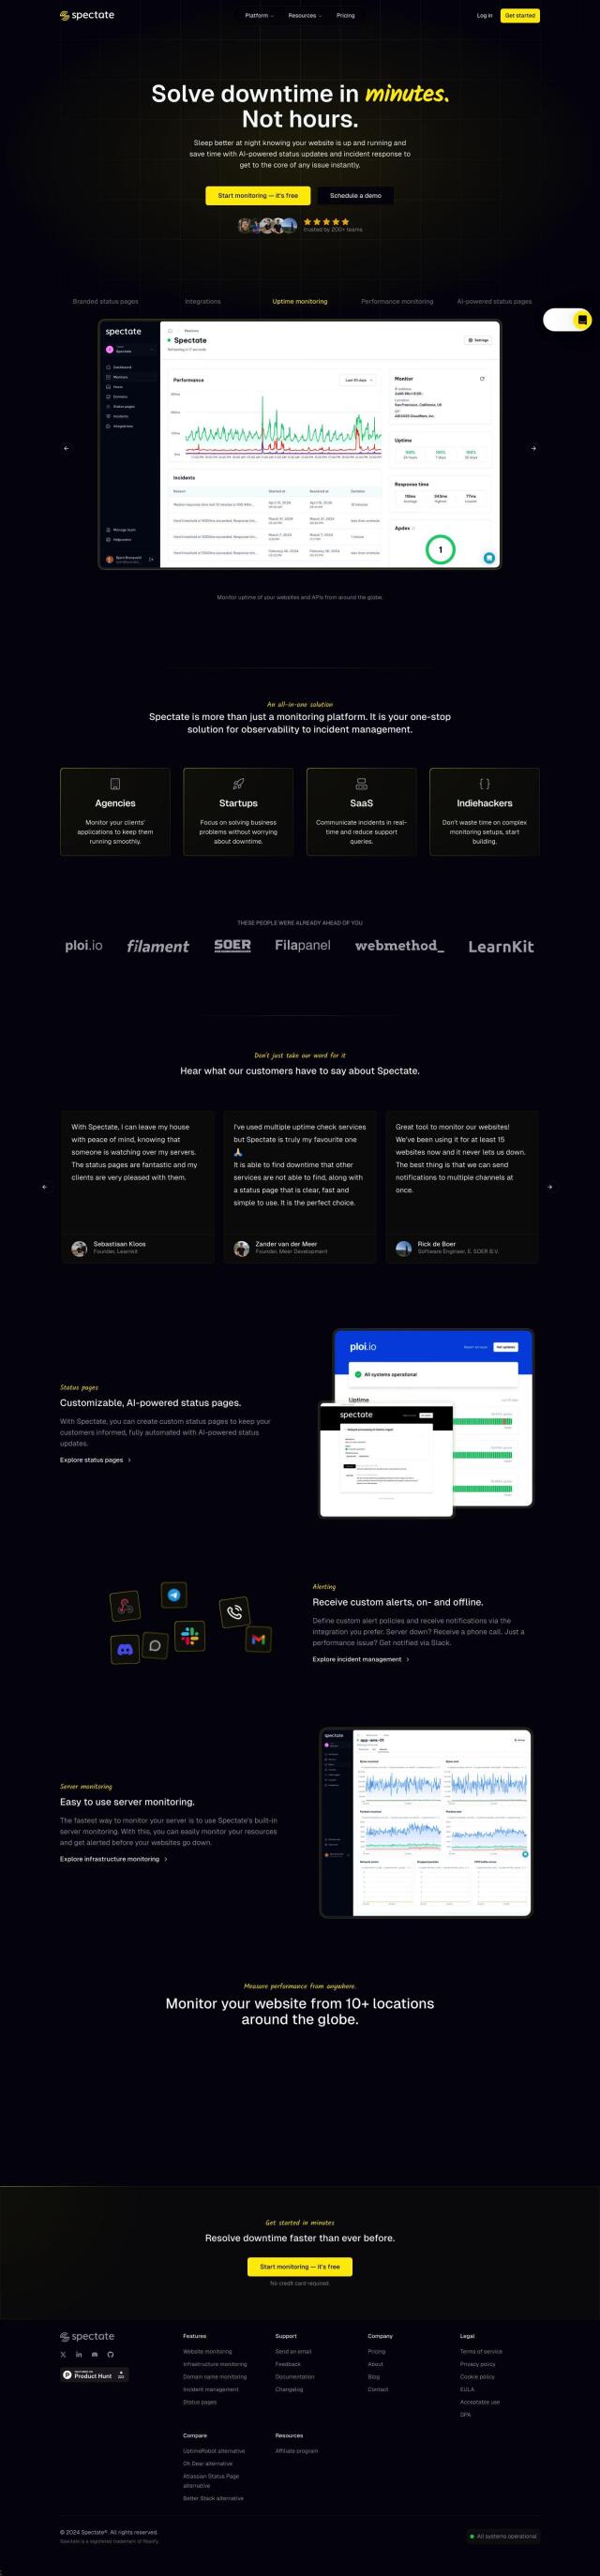
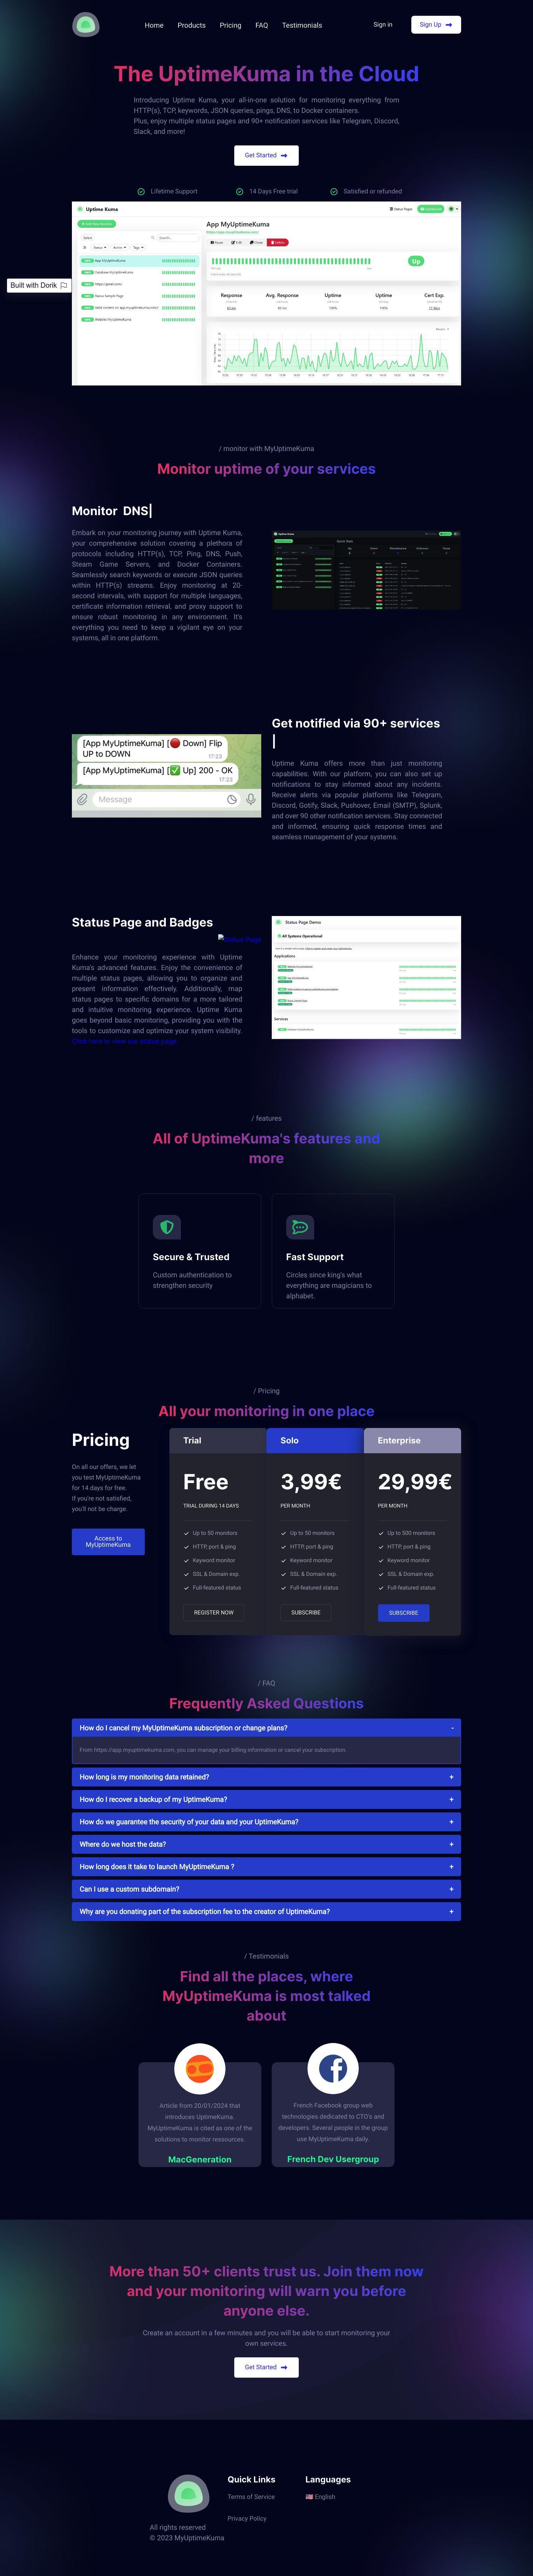
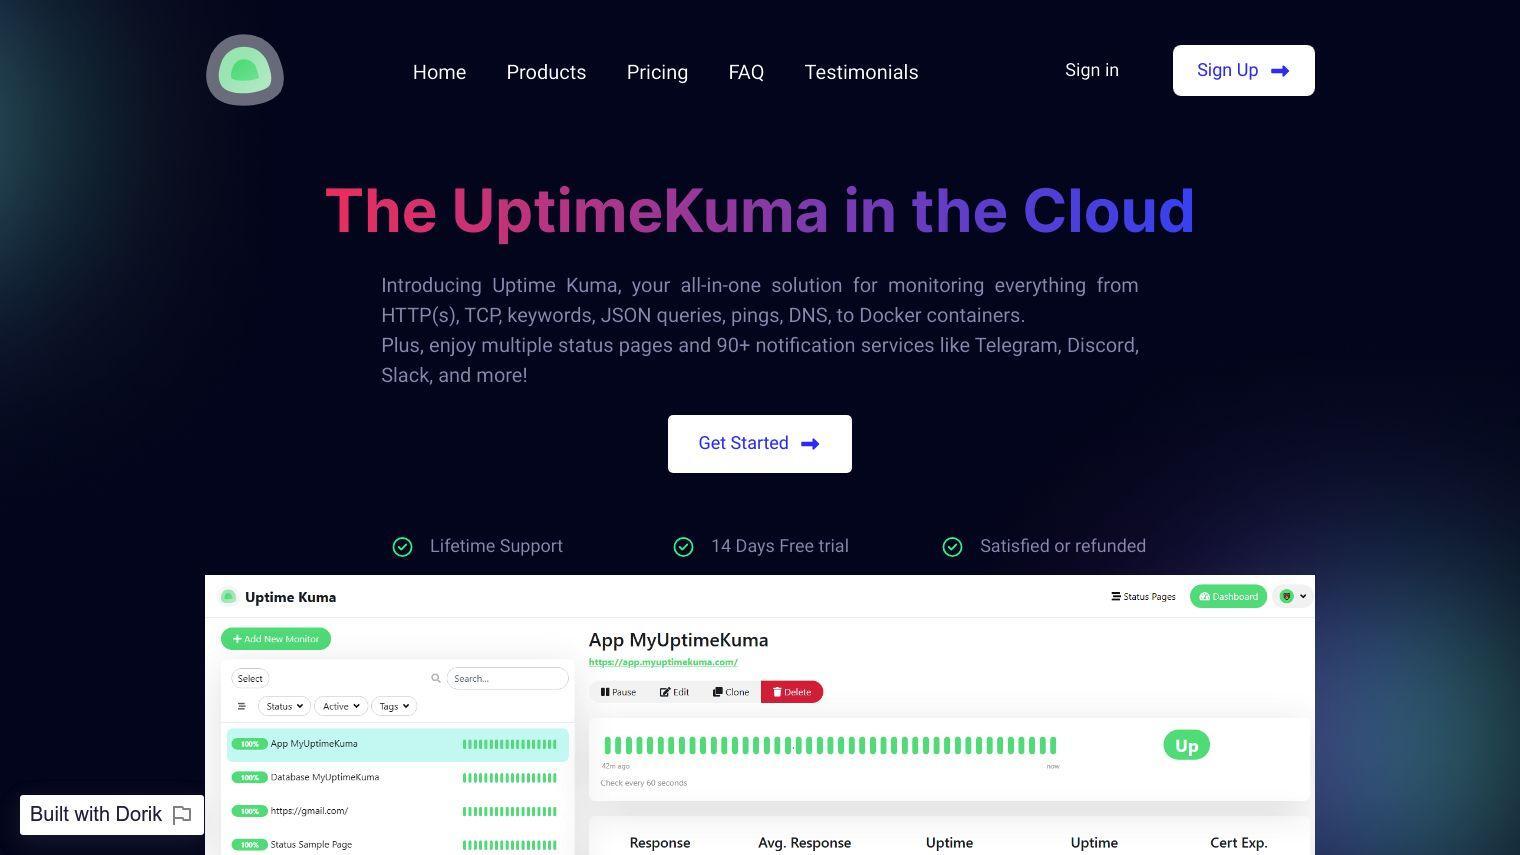
UptimeKuma monitors a wide range of protocols, including HTTP(s), TCP, Ping, DNS and Docker containers. You can search for keywords or run JSON queries on HTTP(s) streams. With support for multiple languages and the ability to retrieve certificate information, UptimeKuma is a powerful monitoring tool.
Some of its other features include:
- Comprehensive Monitoring: HTTP(s), TCP Port, Ping, DNS, Push, Databases, and Steam Game Servers.
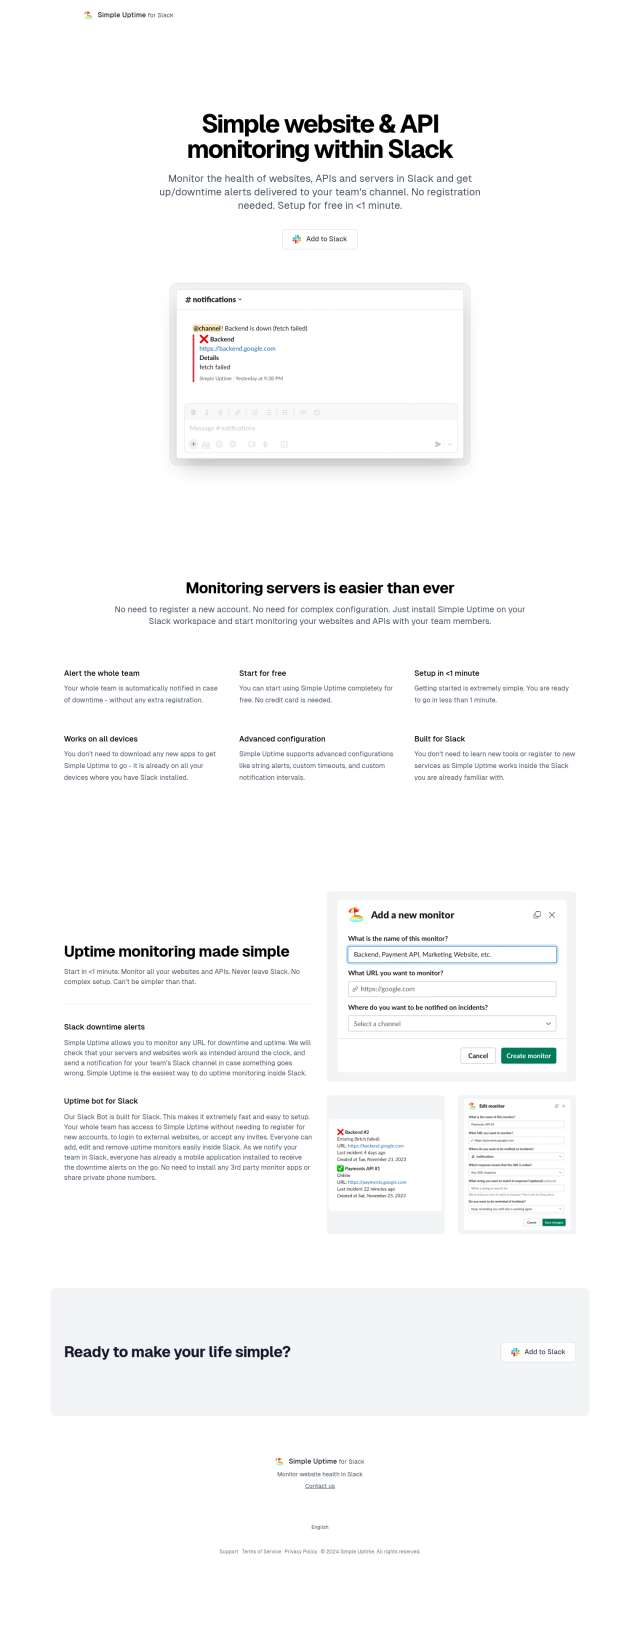
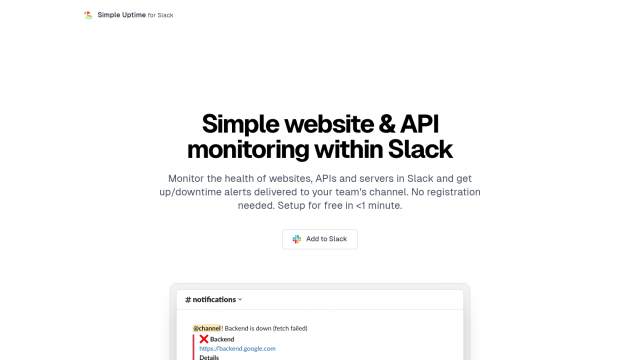
- Notifications: Alerts through more than 90 services, including Telegram, Discord, Slack and email.
- Status Pages and Badges: A dashboard to organize and present data, with multiple status pages possible and the ability to customize with your own domain.
- Security: Custom authentication for extra security, and daily backups for data retention.
MyUptimeKuma's pricing plans are flexible:
- Free Trial: 14 days, 50 monitors, HTTP, port, ping, keyword monitoring, SSL and domain expiration tracking, full-featured status.
- Solo: €3.99/month, 50 monitors, same as the trial.
- Enterprise: €29.99/month, 500 monitors.
All plans come with a 14-day free trial, so you can try the service before you subscribe. Data retention is only available for the duration of the subscription, but you can download your data at any time. If you're not happy, you can cancel your subscription from the app dashboard.
Published on June 13, 2024
Related Questions
Tool Suggestions
Analyzing MyUptimeKuma...