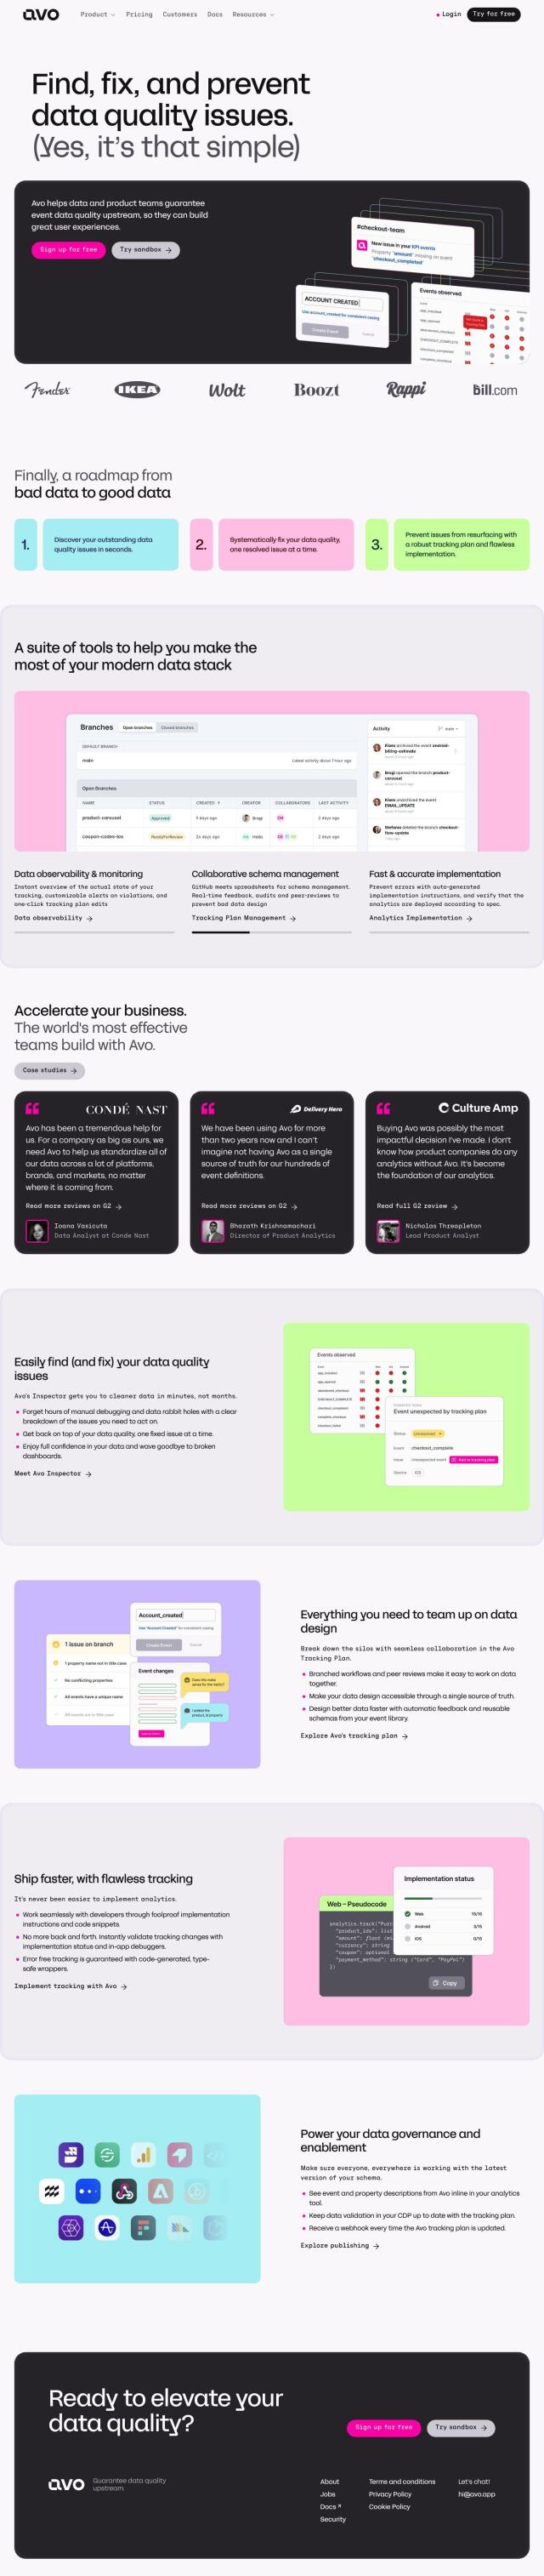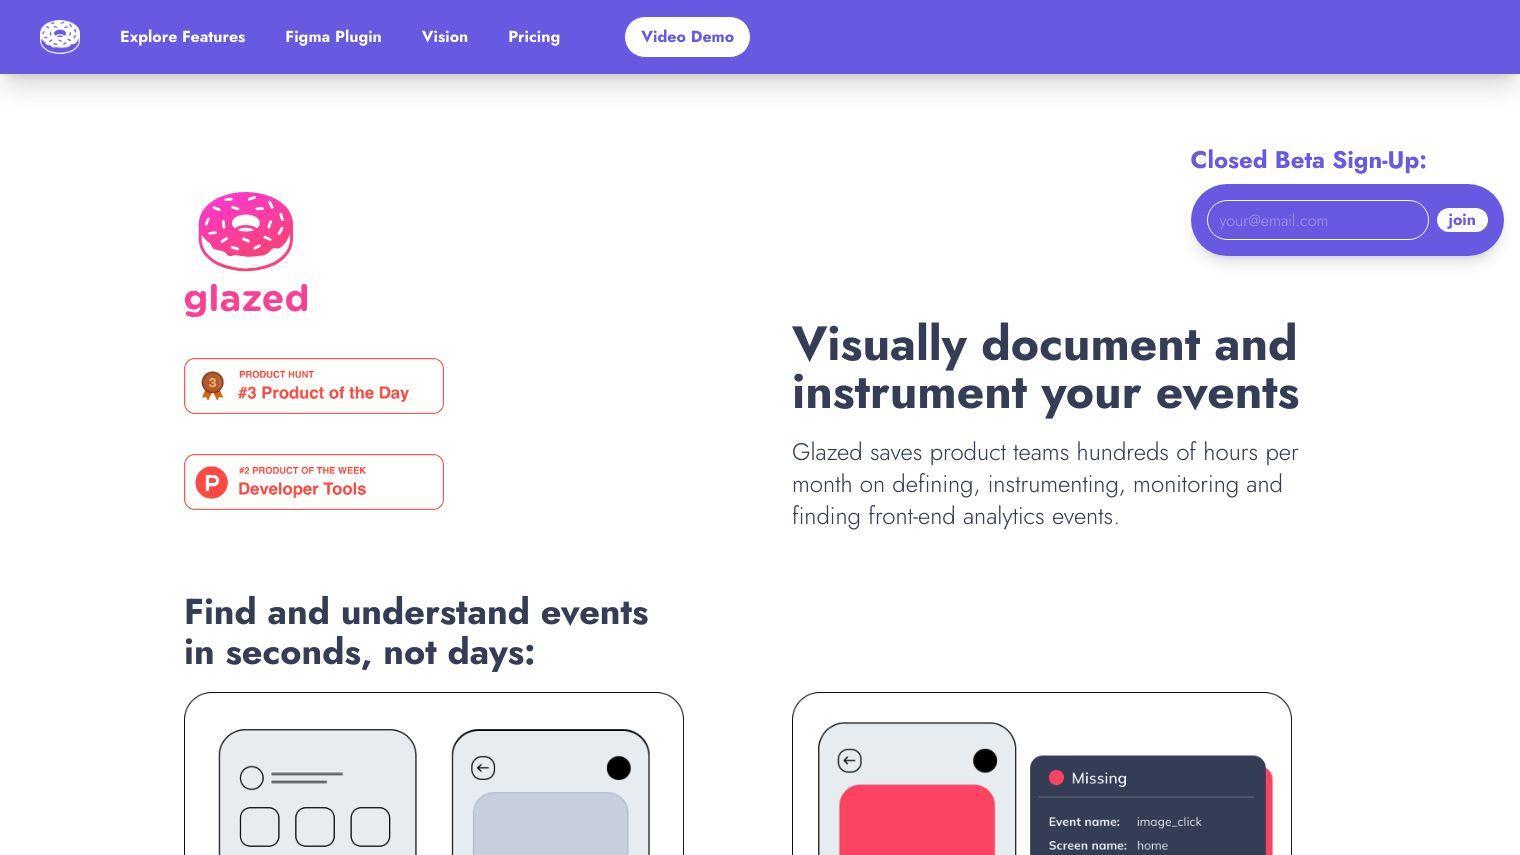

Glazed Analytics cuts the time and labor product teams spend on tracking by visually documenting and instrumenting events, so they can define, measure and control analytics without needing to know how to program. It automates the instrumentation process so teams can get up and running 5x faster and QA 10x faster.
Glazed's visual interface lets you drill down to find events and understand what they mean by clicking on elements to see their documentation. That means you can avoid tracking implementation bugs and release delays and get teams working together more easily. Anyone can get basic answers in seconds, which means fewer ad-hoc requests and Slack pings.
Glazed's single source of truth means autonomous teams can define, discover and agree on a tracking strategy. It also keeps track of design and event changes, so you can see what's changed and how that affects user behavior.
Glazed fits into existing workflows and tools so it's good for agile, multi-functional product teams. Options include:
- Explorer: Good for small teams and small projects. It costs €149/m with a 7-day free trial, supports up to 5 users, 3 design files and 30 days of history.
- Team: For multiple teams.
- Custom: Supports unlimited users, design files, automated QA, 1 year history, third-party connectors and dedicated support.
Glazed's goal is to be the single source of truth for all tracking documentation, with an emphasis on data quality and accessibility and a reduction in manual work. If you invest in Glazed, your team gets trusted, understandable data without needing to know how to program or use complicated spreadsheets. Glazed is designed for a culture where data insights are available fast.
Published on June 14, 2024
Related Questions
Tool Suggestions
Analyzing Glazed Analytics...